Background and context
As the lead designer, I spearheaded the development of a groundbreaking application in collaboration with Goodyear and NASCAR. This tool revolutionizes pit crew operations by proactively identifying tire events, enhancing performance, safety, and strategic decision-making on the track. My role underscores the pivotal contribution of design expertise in driving progress within NASCAR and solidifying Goodyear's position as a technological pioneer in motorsports.
The Team
-
Product manager
-
Product designer
-
Lead engineer
-
Engineer (3)
Timeline:
4 weeks

Goals
These goals were derived from the partnership goals from Goodyear and NASCAR

Streamline manual work for tire management at pit road

Showcase the advances NASCAR has made using big data and advanced technologies

Engage more fans through advancements in technologies
Research
Due to the complexity of the needs across stakeholders and environments, this project started with multiple forms of research.
1. Field studies
We started with a field study observing the Goodyear team at 2 NASCAR races. During this observation period we focused on the types of decisions that users had to make at pit row, and the environment the decisions were made in.
After several days of this observation, I had a couple of key takeaways:
-
a significant portion of the work completed at the race was in collecting information to be analyzed later by various teams. This information was used to help teams prepare their pit strategy, and help the Goodyear crew to make more reliable tires.
-
capturing information needed to be done quickly given the fast moving environment and all of the distractions and demands of Pit Row.
-
users collected the same type of information across pit crews and races.
2. Artifact analysis
After gaining insights into users' information collection practices, the Product Manager and I conducted a thorough review of the notebooks used by tire engineers for race data. Our meticulous examination revealed recurring key terms, numbers, and phrases in the documentation from nearly every race.
Research conclusion
As a result of the user research, we determined the problem areas we could best address were in collecting data efficiently, and allowing users to review and manage this data after it had been collected.

Solution definition
User needs:
Based on the research and goals, we narrowed the first pass of the product down to five key tasks:
-
A way to quickly capture observational race data (cannot be automated)
-
A way to view automated data as it comes in
-
A way to share information with others
-
A way to analyze the collection of information at a later point in time
-
A way to be notified of significant anomalies in the data
User Journey & Information Architecture :
After establishing the needs, I mapped out the information architecture and user journeys together. Given the inherent connection between the experience and information navigation, it was logical to consolidate these steps.

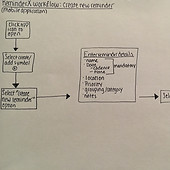
Wireframe
After establishing the key tasks and journey, I moved on to wireframes. I came up with several approaches, but ultimately narrowed to one solution to paper prototype.
Solution description:
The product would consist of 3 main pages.
1. Data Log (need: capture observational race data)
-
A digital notebook with entries for each race
-
Included a tagging system for categorizing notes
-
Included a keyboard with hot-buttons that were pulled from the notebooks in the artifact analysis we had previously
2. Team Chat (need: share information with others, notified of anomalies)
-
A live-stream chat for pit crews and the Goodyear team to share notes about the race
-
Included system notifications regarding automated data
3. Data visualization (need: view automated data, analyze collected information)
-
graphs and visualizations broken down by race and event
-
Available and updated live, also available to review more deeply at a later point
-
exportable visualizations designed to be shared with others outside of the application

Paper prototype
keyboard with hot buttons example
Testing
I took the paper prototypes and had 7 of the tire engineers from Goodyear and NASCAR pit crews walk through the product to accomplish key set tasks.
Outcomes:
-
Users liked the hot-keys and log. They found them to be intuitive and there was a large appetite for moving towards this more advanced solution
-
Users expressed a desire for additional features (such as search in the chat or the ability to tag other users in notes and data)
-
Users were concerned about the ability to gain meaningful insights from visualizations on a mobile app
High fidelity and hand off
Due to the short timeline we had to wrap up work fairly quickly. We decided to use Goodyear's existing component library and assets rather than create something new. I created high fidelity versions of the updated designs based on the testing feedback and handing them over to a team of developers.


Challenges, learnings, and next steps
There were a lot of challenging aspects for this project, such as the wide variety of stakeholders, short timeline, and harsh environment in which the app was to be used. In overcoming these obstacles I learned several significant lessons in stakeholder management, key differences between designing for websites to be used at a desk vs mobile applications to be used in out in the world.
There was a lot of content that could not be covered in this short portfolio review, but we were able to fully achieve two of the goals (automate manual workflow and showcase big data and technology). The third (engaging fans) was deprioritized in favor of compleing the project within the set timeline.
Next steps I would explore
-
Measure the use of the application against success metrics
-
Explore the need for a desktop option for viewing race data after-the-fact